Behavioral context representation in the visual cortex during perceptual tasks
Hajnal, M.A., Tran, D., Einstein, M., Vallejo Martelo M., Safaryan K., Polack P-O. *, Golshani P. * and Orbán G. * (2023) Continuous multiplexed population representations of task context in the mouse primary visual cortex. Nature Communications 14, 6687. * equal contribution
Effective task execution requires the representation of multiple task-related variables that determine how stimuli lead to correct responses. Even the primary visual cortex (V1) represents other task-related variables such as expectations, choice, and context. However, it is unclear how V1 can flexibly accommodate these variables without interfering with visual representations. We trained mice on a context-switching cross-modal decision task, where performance depends on inferring task context. We found that the context signal that emerged in V1 was behaviorally relevant as it strongly covaried with performance, independent from movement. Importantly, this signal was integrated into V1 representation by multiplexing visual and context signals into orthogonal subspaces. In addition, auditory and choice signals were also multiplexed as these signals were orthogonal to the context representation. Thus, multiplexing allows V1 to integrate visual inputs with other sensory modalities and cognitive variables to avoid interference with the visual representation while ensuring the maintenance of task-relevant variables.
Figure
Caption
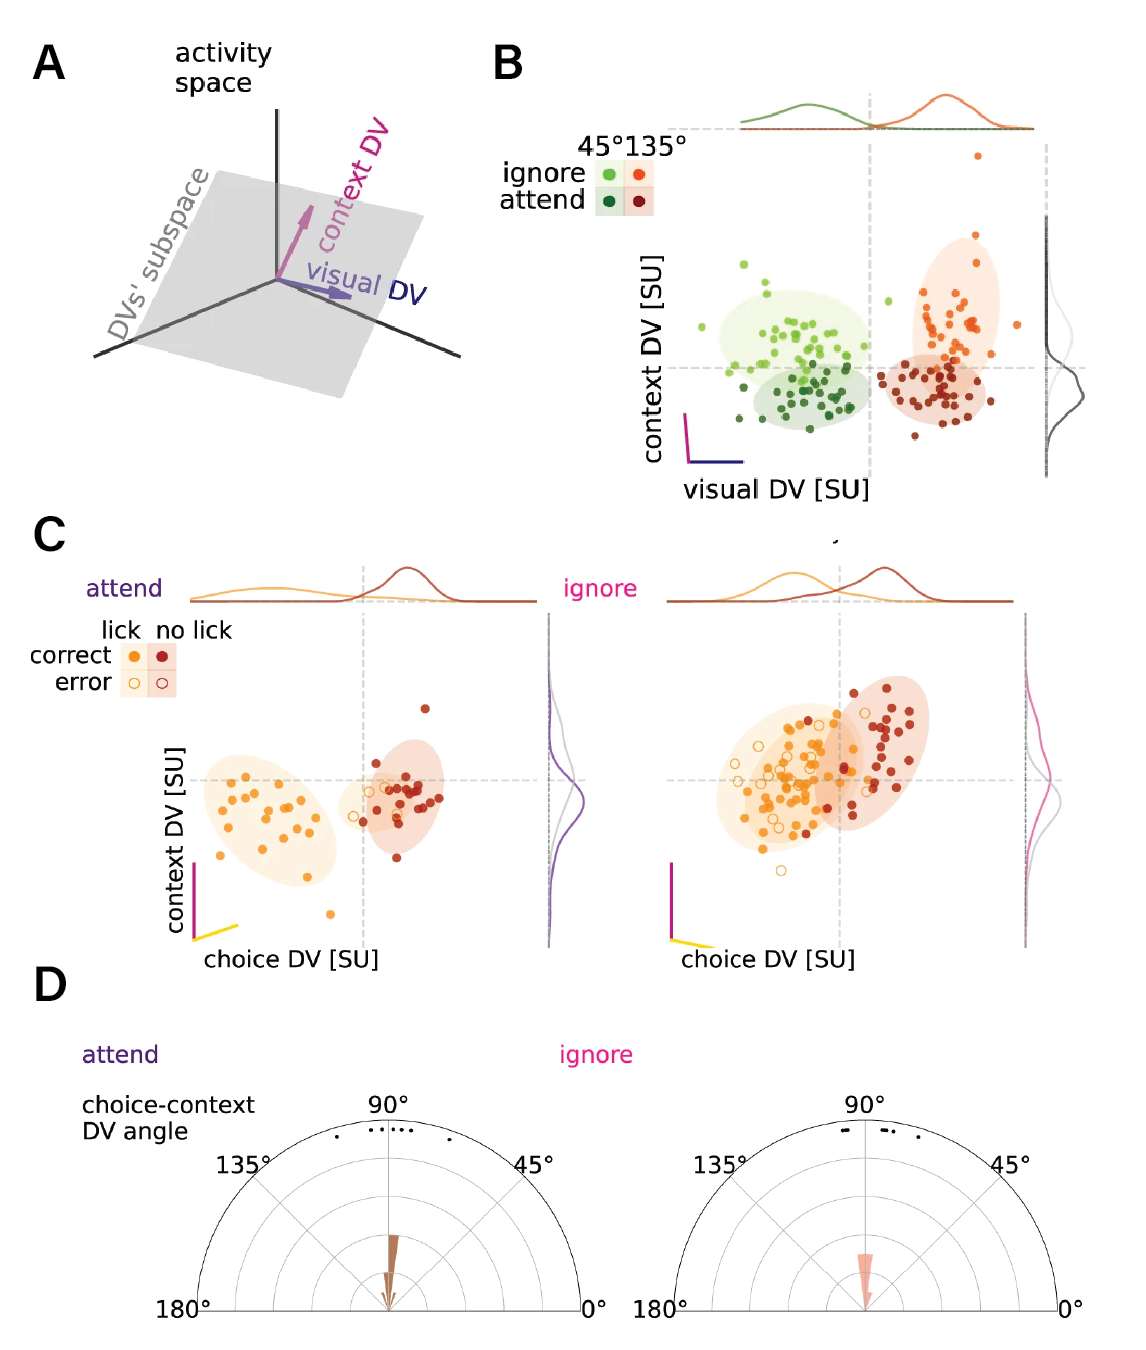
A. Combination of multiple decision vector (DV) bases forms a new basis that defines a higher dimensional subspace of task relevant population activity. B. Population responses of an example animal, averaged over the first 1.5 s of stimulus presentation projected on the DV subspace in individual trials (dots), and their estimated normal distribution (mean and 2 std, shaded ovals) in different task contexts (dark and light) and with different visual stimuli presented (red and green). Purple and blue lines denote the DV directions of context and visual decoders, respectively. Histograms show population responses projected on orthogonal components of single DVs. C. Population responses projected on the DV subspace of context (magenta line) and choice decoders (yellow line) in individual trials (dots) and their estimated normal distribution (mean and 2 std, shaded ovals) in different task contexts (left and right panels) and with different choices the animal made (orange and red for ‘lick’ and ‘no-lick’, respectively) for an example animal. Since the choice decoder changes across task contexts, different DV subspaces are used (left and right panels for ‘attend’ visual and ‘ignore’ visual context, respectively). Distributions show the marginal of population responses (gray lines indicate the distributions for the opposite context). D. Histograms of the angle between context and choice DVs across animals (dots) in the two task contexts (left and right).


